How to Convert a Normal Query to a Crosstab Query in Access
Turn a select query into a crosstab query for a more readable set of results.
Sometimes a normal (select) query will return results, where, some fields need to be duplicated in order to show all the data.
A crosstab query allows you to group the query results in a way that removes the duplicate values, and presents the results in a way that makes them easier to read and decipher.
Here's an example.
-
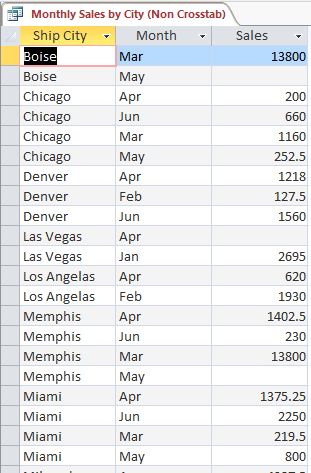
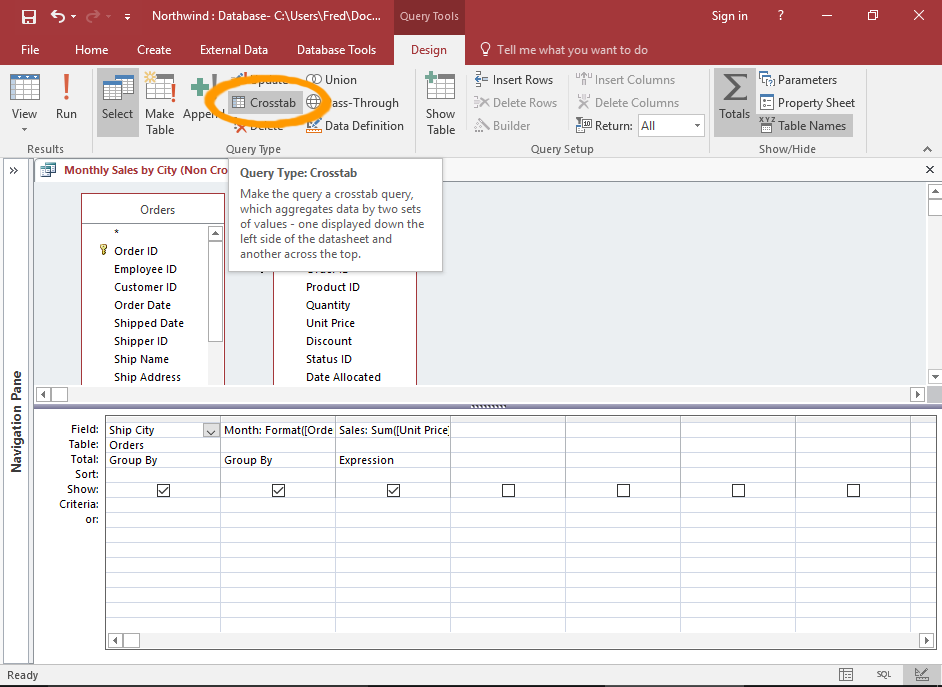
Normal (Select) Query
This query displays monthly product sales from each city.
Because there are many months, each city needs to be duplicated for each month of sales.
-
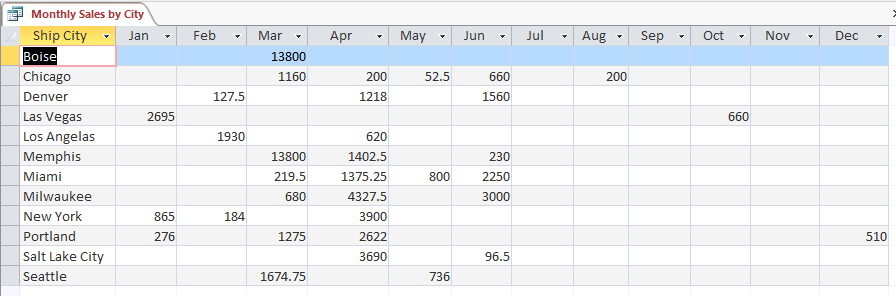
Crosstab Query
Here's the same results, but this time displayed using a crosstab query.
In this query, the months have been moved to the top, as column headers. Now, each city only needs to be displayed once, because the months are listed in columns.
Here's how to convert the first (select) query to the second (crosstab) query.
-
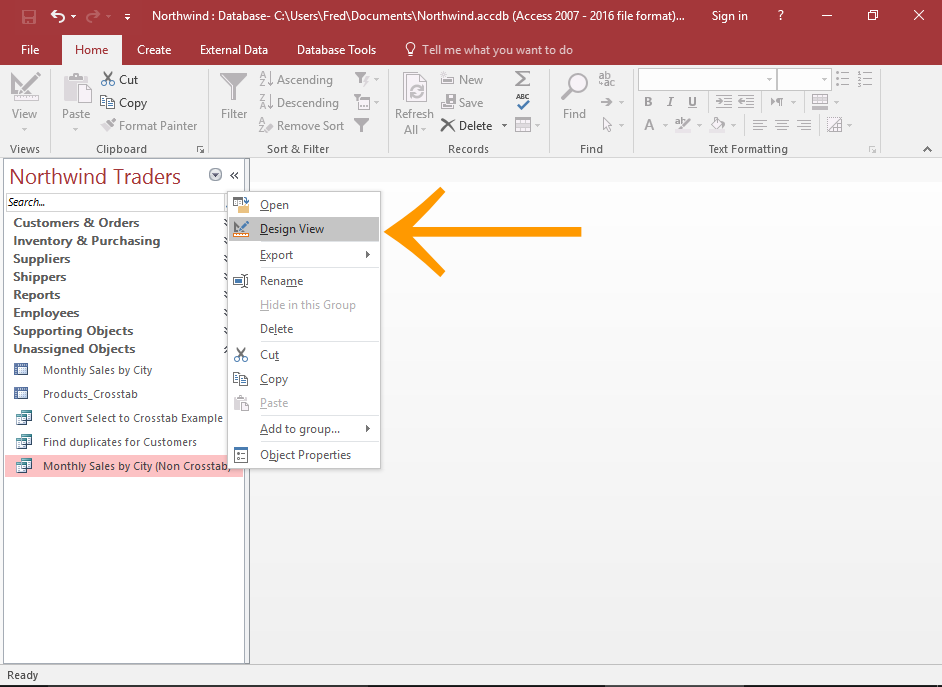
Open the Query in Design View
In the Navigation Pane, right-click on the query and select Design View from the contextual menu.
This opens the query in Design View.
If you already have the query open in Datasheet View, you can simply switch to Design View.
-
Convert the Query
Click Crosstab from the Query Type group in the Ribbon (from the Design tab).
This immediately converts the query from a select query into a crosstab query.
You can also right-click anywhere in the Diagram Pane and select Query Type > Crosstab Query from the contextual menu.
-
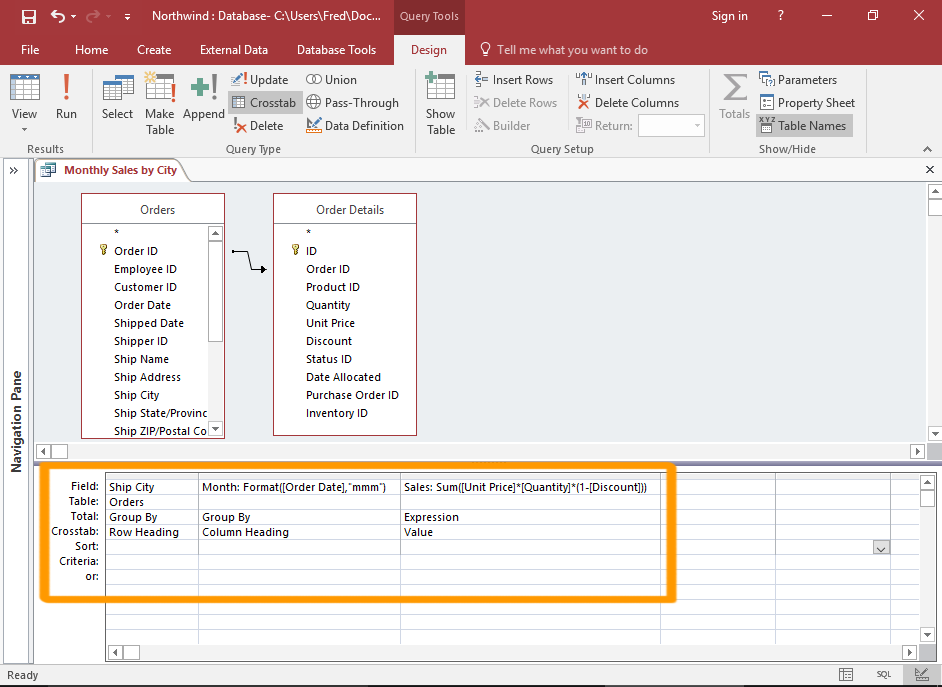
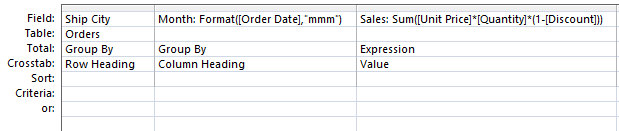
Add the Crosstab Criteria
You can now see that a Crosstab row has been added to the bottom Criteria Pane (and the Show row has been removed).
The Crosstab row allows you specify which field/s will appear as row headers and which field will appear as row headers.
The Total row allows you to specify how the results will be grouped, as well as any expressions/functions to apply to a given field.
In this example, the Ship City field is the row header, and the Order Date field is the column header.
Note that this field is also being formatted using the
Format()function, so that the dates are displayed as months (and the results are grouped by month). -
The Query Result
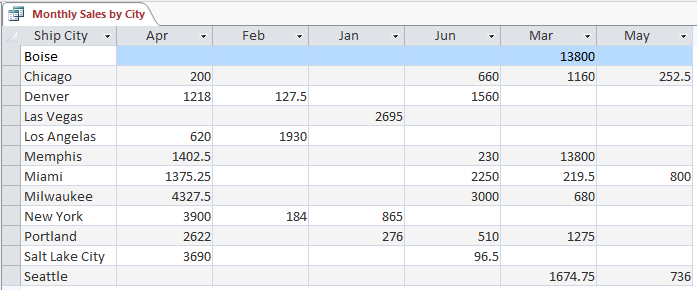
When we run the query, we see that the months are listed as column headers, and the results are more compact.
Missing Fields?
See Fix Missing Fields in a Crosstab Query to display all columns regardless of whether there's data for that column.
Applying this technique on the above query will result in all 12 months of the year being displayed, even though some months don't have any data to display.